Getting started
CoroPlus® Machining Insights includes different screens, which help you to get insights into your machine data and optimisation opportunities.
Working with CoroPlus® Machining Insights
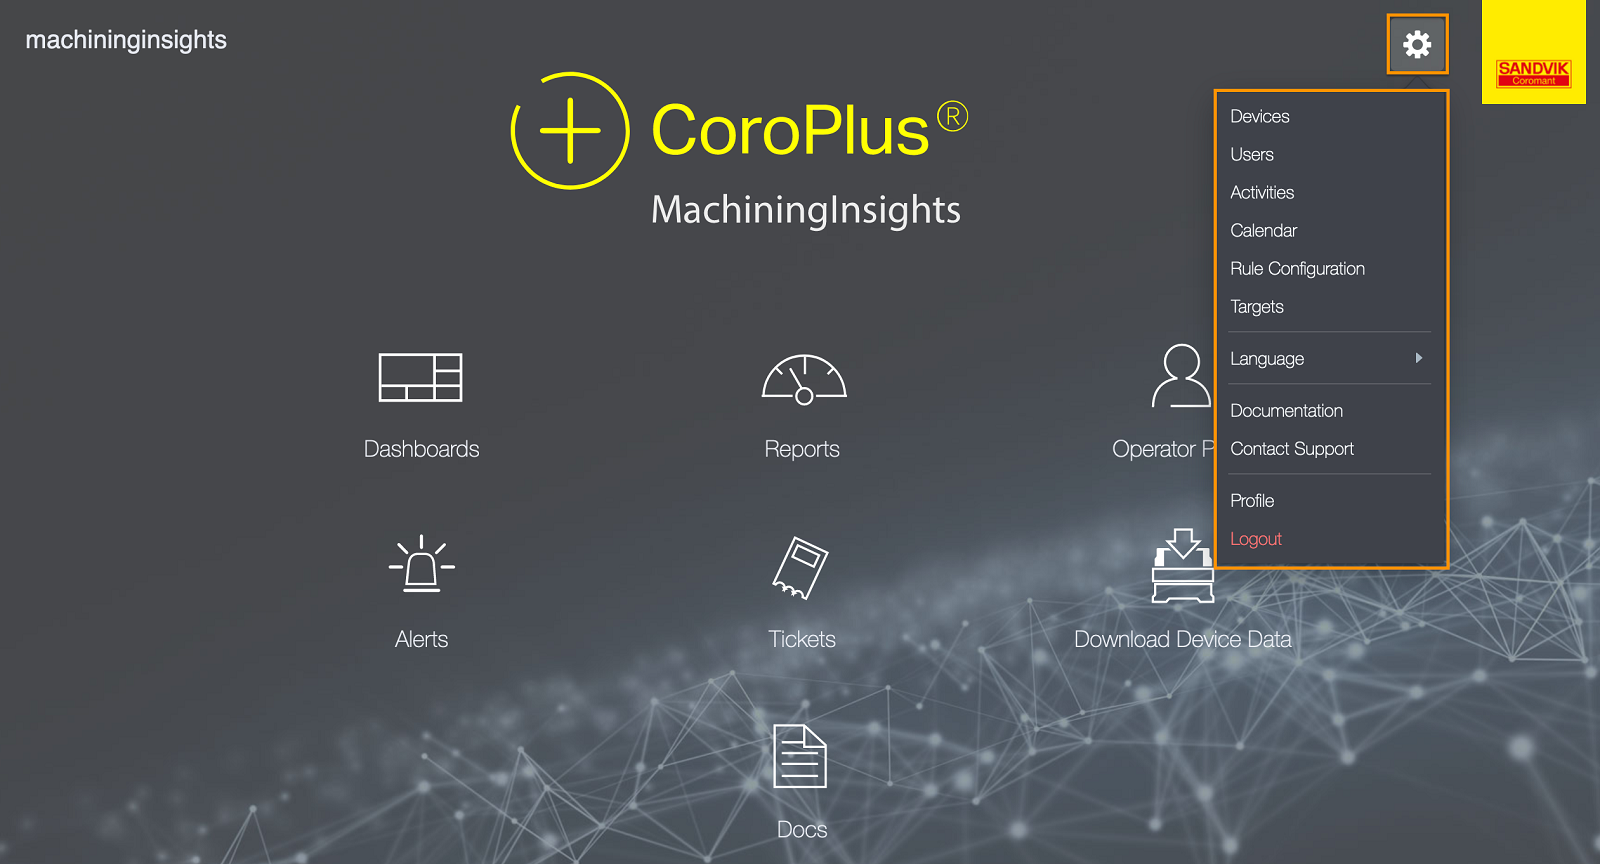
The application’s Home screen is the initial point for accessing all screens.
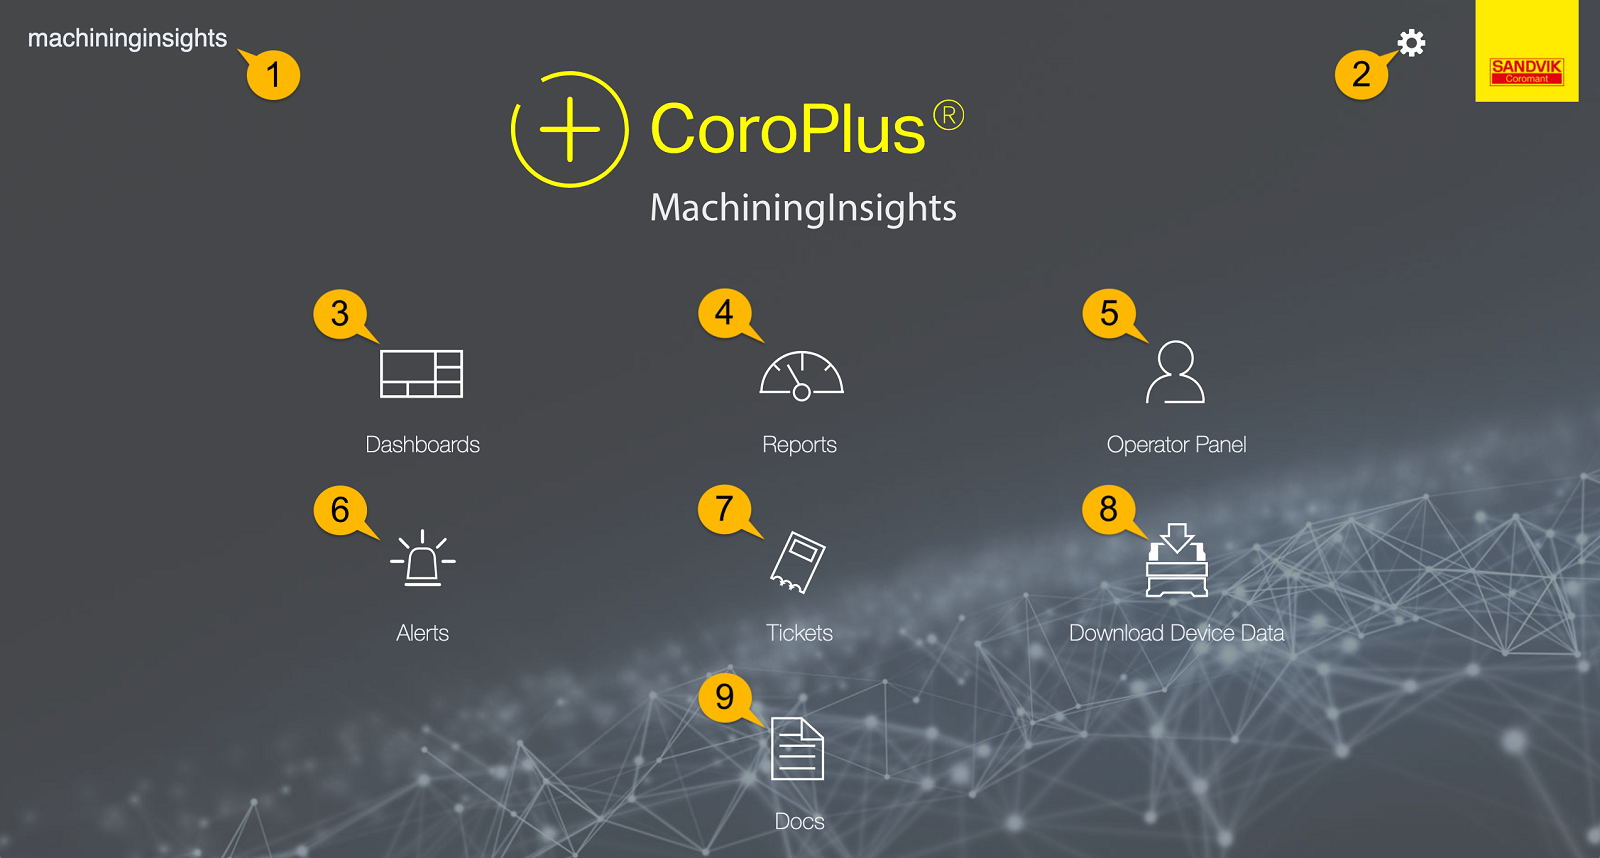
- Plant name
Give each plant a unique name so that it can be easily distinguished. - Main menu in the top right corner
You can access all settings of CoroPlus® Machining Insights from the main menu. - Dashboards
Get a real-time overview of how your machines are performing. - Reports
Take a look into the history combined with operator input and make informed decisions in the shop. - Operator Panel
Get the essential information on why the machines are standing still by classifying the standstill into different categories of your choice. - Alerts
Allow the user to see crucial information about the machine and configure the alert watcher rules. These rules will automatically email the user or group of users of the incident at the machine. - Tickets
Are how the operator can alert other departments or managers of issues that need immediate attention without leaving their machine. The ticket report is how the operations team ensures that the issues are assigned and competed. - Download Device Data
In this section you can download detailed information about the device in CSV format. Detailed information helps in troubleshooting and determining a root cause for the device. - Docs
The docs page is for the how-to of CoroPlus® Machining Insights. Here you will also have access to videos of the common task in CoroPlus® Machining Insights, such as creating or updating the calendar or the Operator Panel.
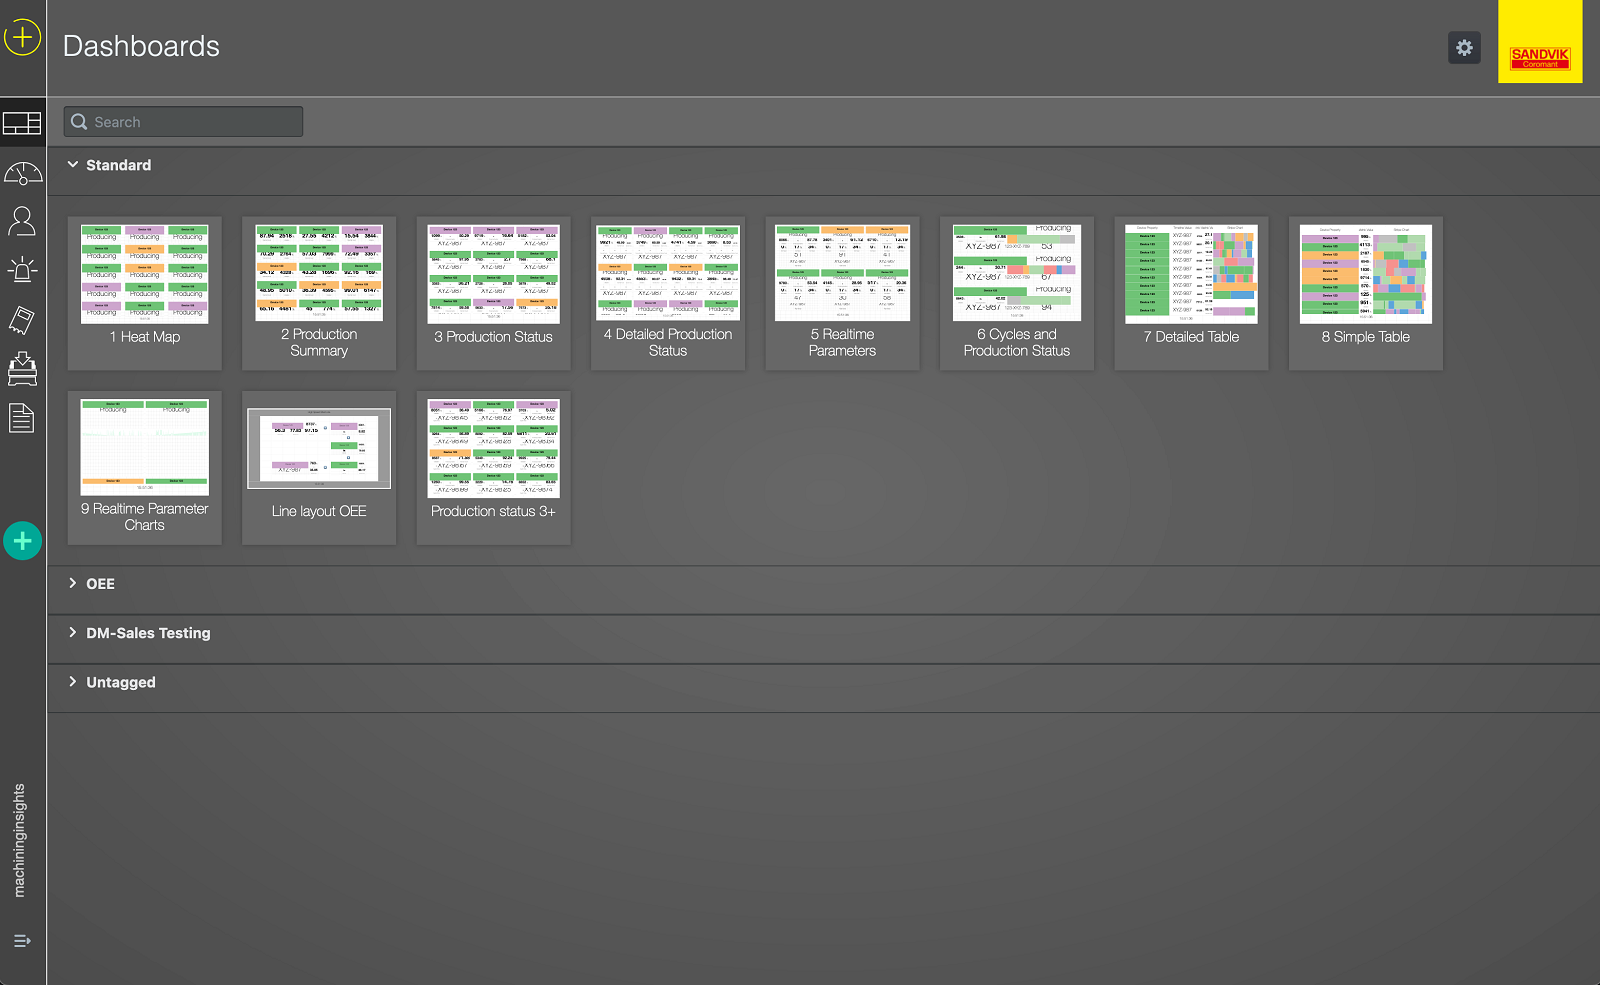
Dashboards screen
In the Dashboards screen, you can select one of the preconfigured, standard dashboards, such as Heat Map or Production Summary, or search for a specific one.
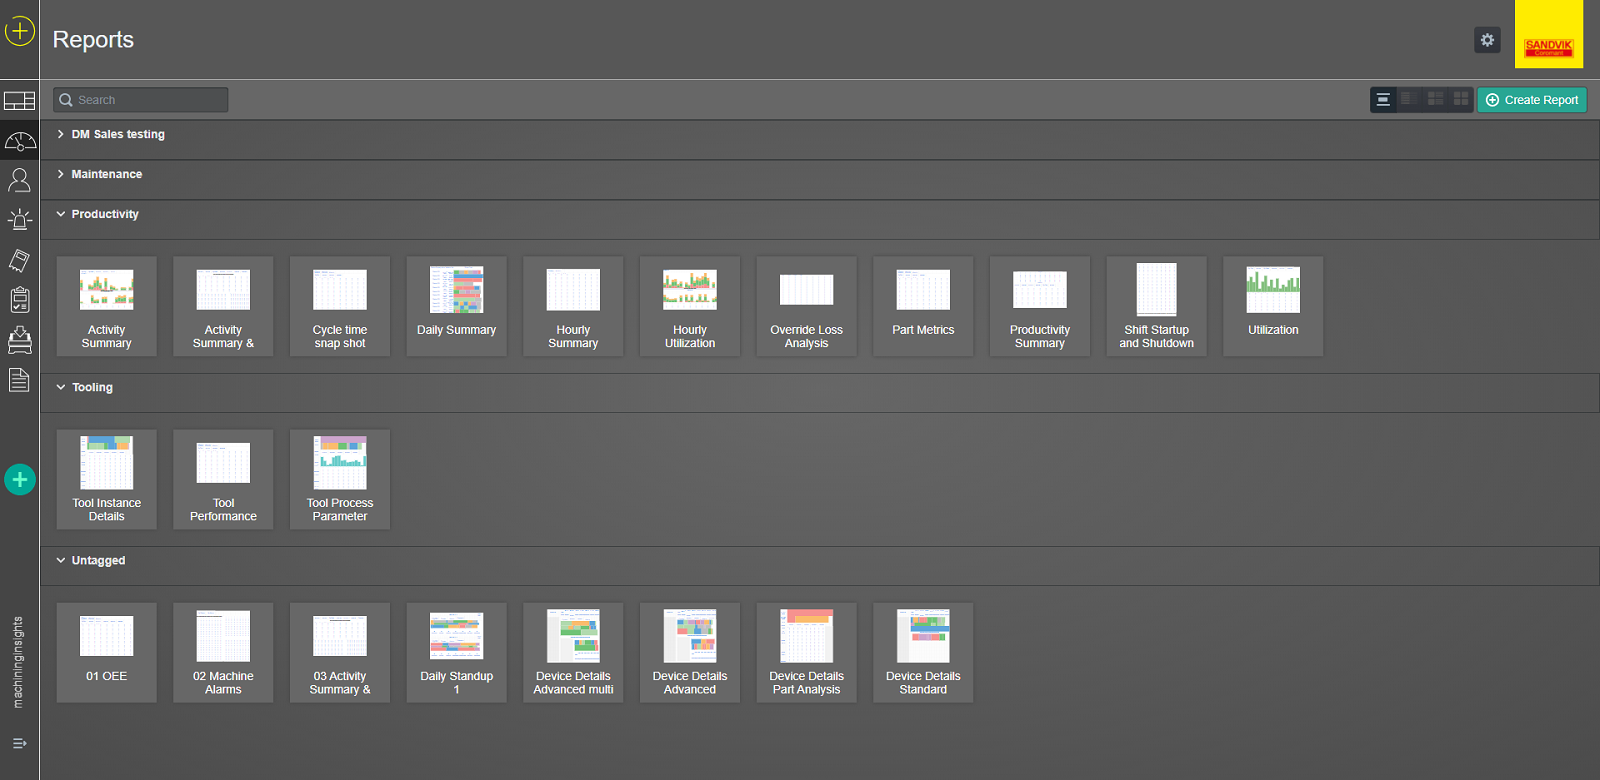
Reports screen
In the Reports screen, you can select one of the preconfigured reports, such as Activity Summary or the Tool Instance Details, or search for a specific one.
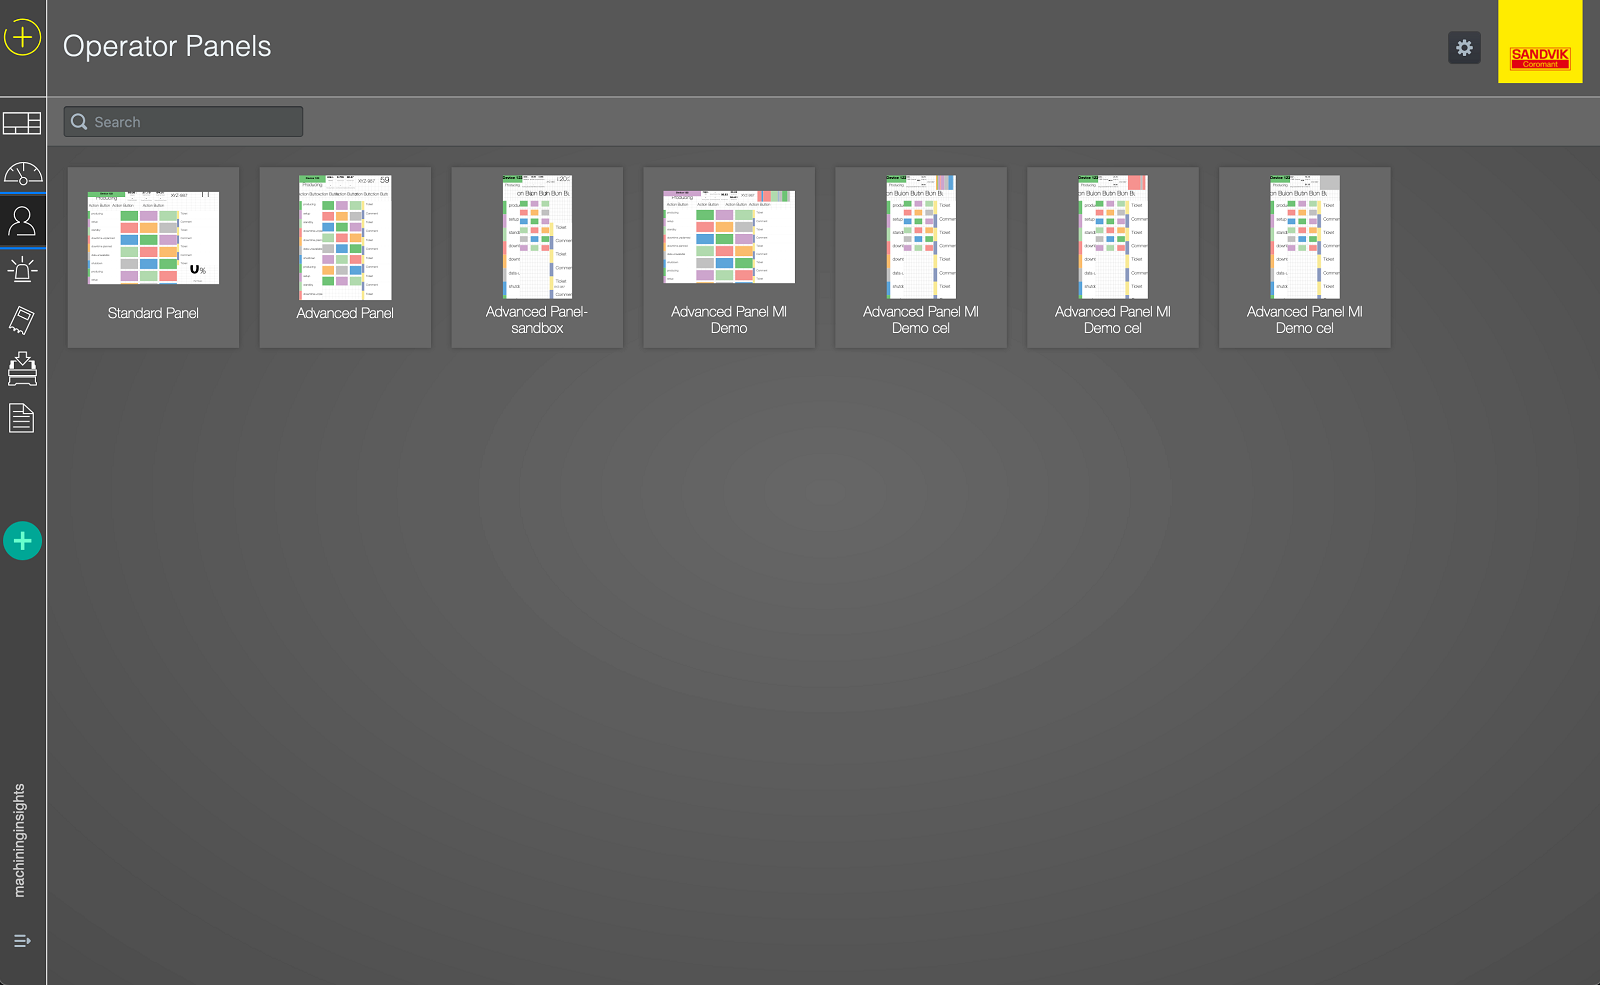
Operator Panels screen
In the Operator Panels screen, you can select one of the preconfigured panels, like the Standard Panel or the Advanced Panel.
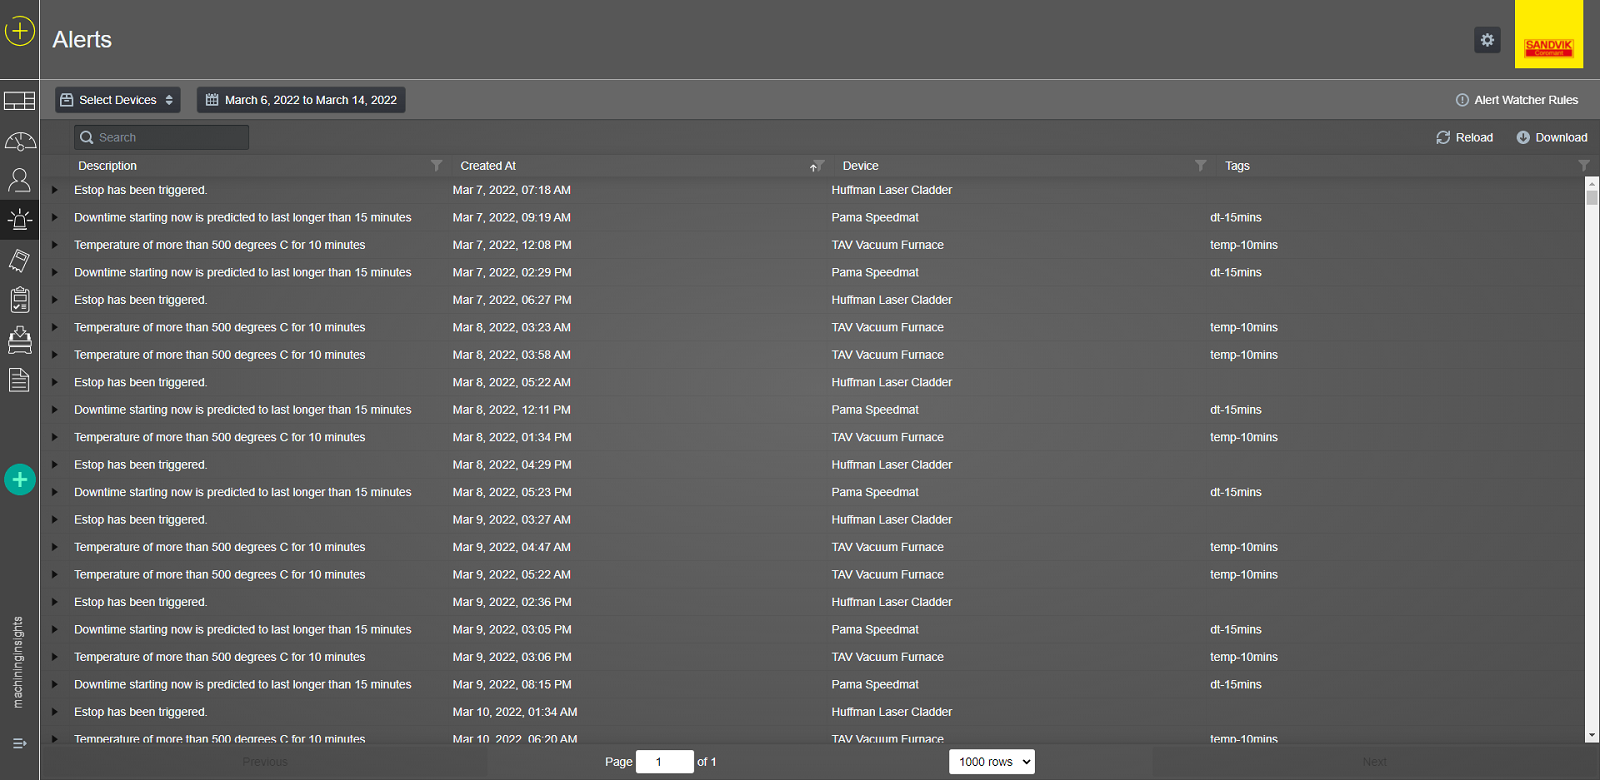
Alerts screen
The Alerts screen lists all alerts that occurred. You can sort the list by, for example, date or filter by a specific device. You can also setup automated alerts to go to an email or text message.
Settings within CoroPlus® Machining Insights
You can access all settings through the main menu in the top right corner.
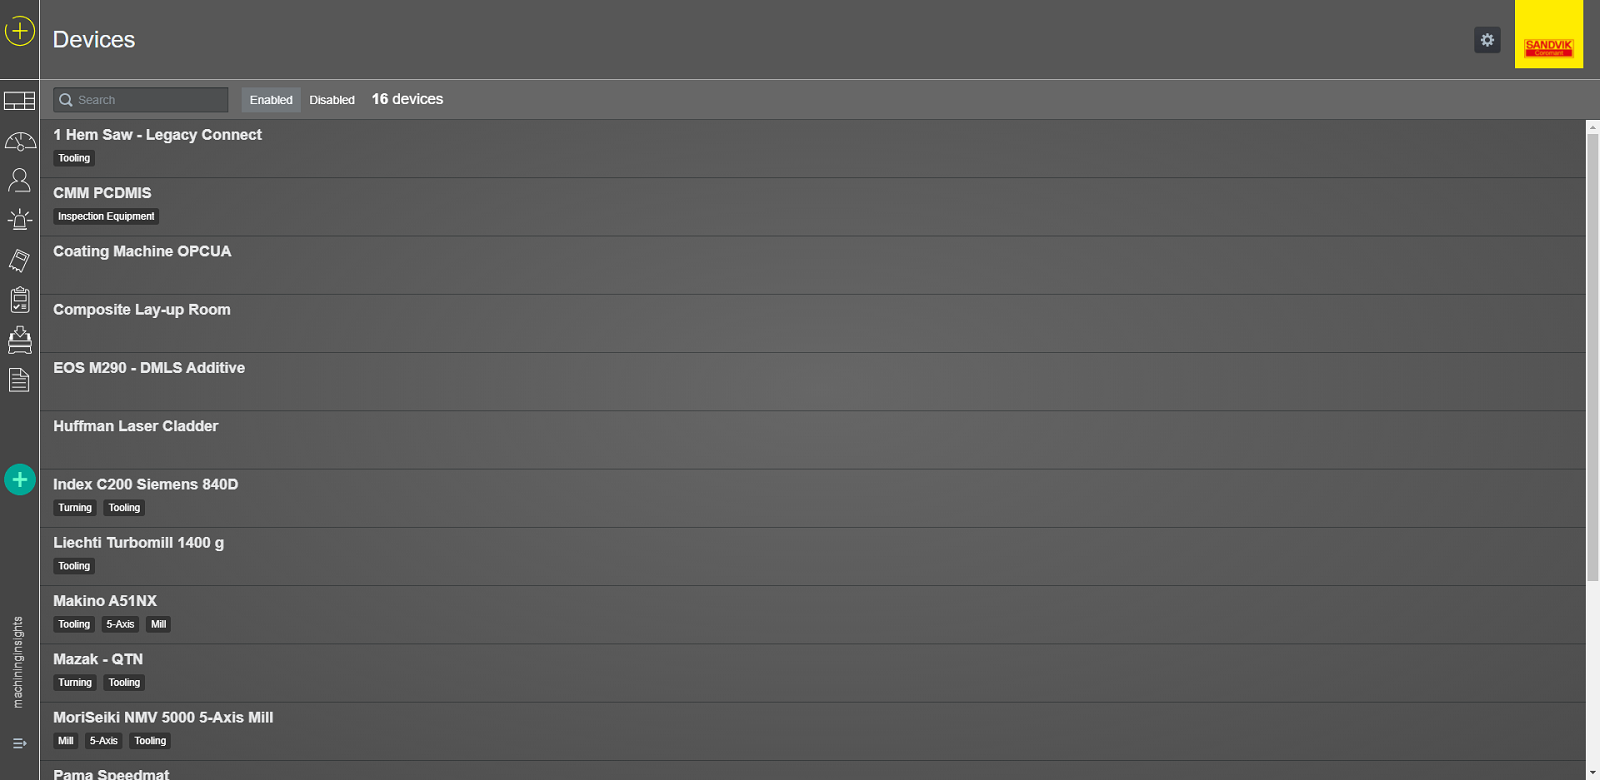
Devices
In Device, you can see all connected devices. When you open devices, all enabled devices are displayed. You can also view the disabled devices, search for a specific device or change a device's configuration.
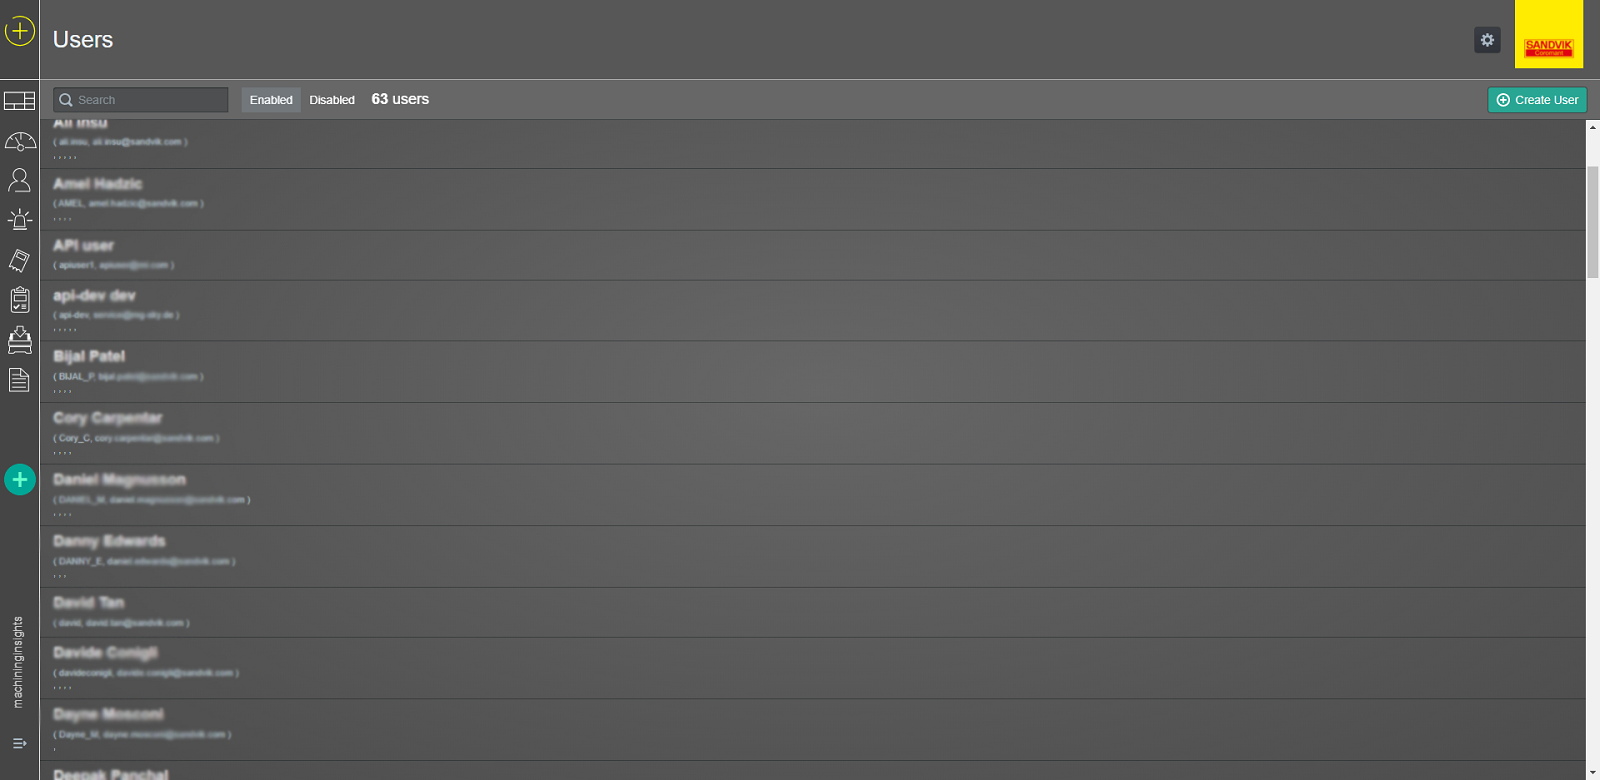
Users
In Users, you can see all created users. When you open Users, all enabled users are displayed. You can also view the disabled users, search for a specific user, create a new user or change the configuration of an existing user.
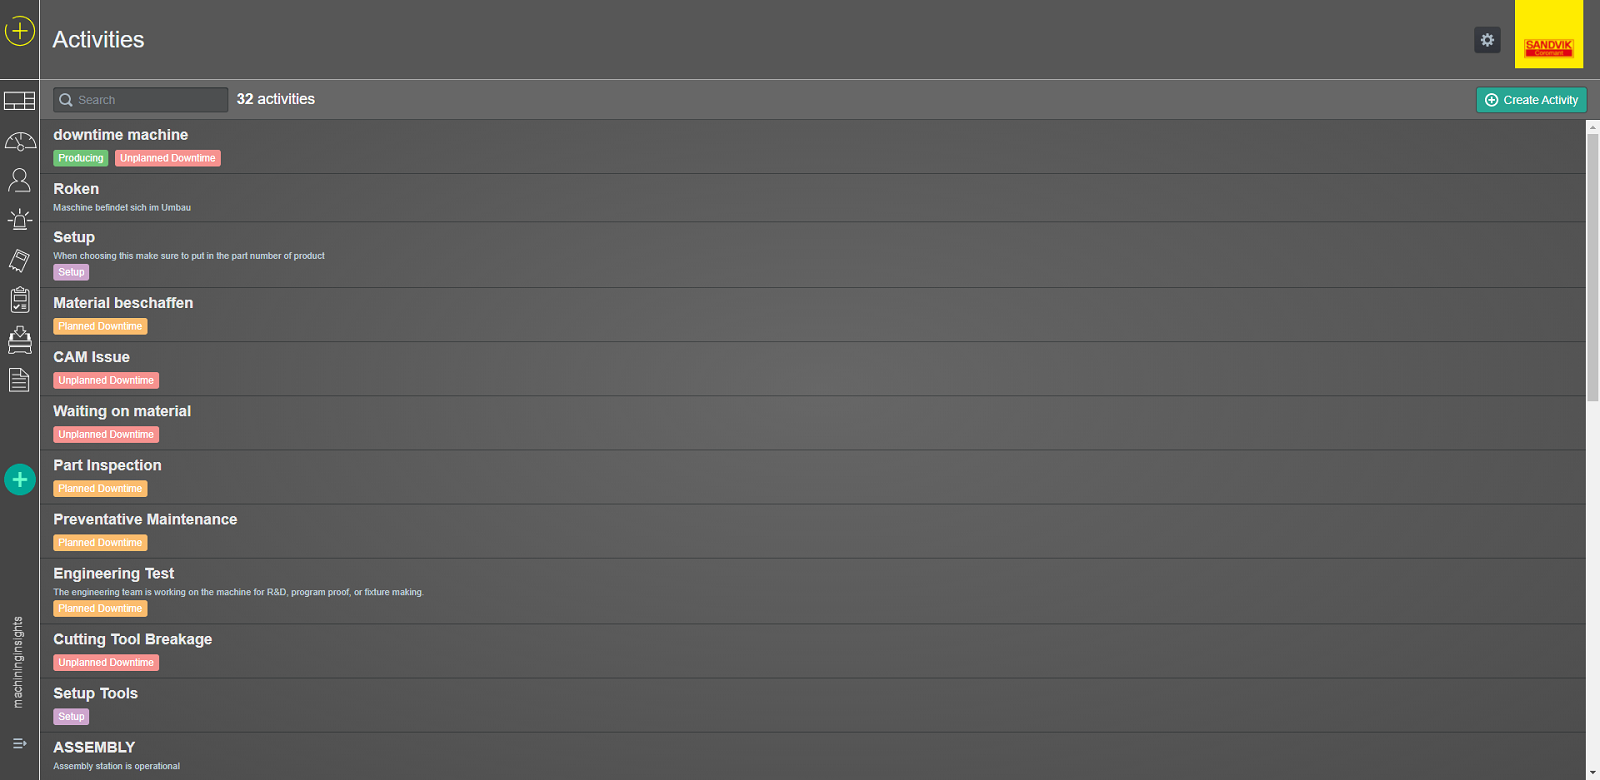
Activities
In Activities, you can see all created activities. You can search for a specific activity, create a new one or change an existing one. In editing an activity, you can specify what actions are associated with an individual or group of machines, in addition to adding actions when an Activity is selected. For instance, requiring a comment to be created, ticket to be created or to update the active part kind or process count.
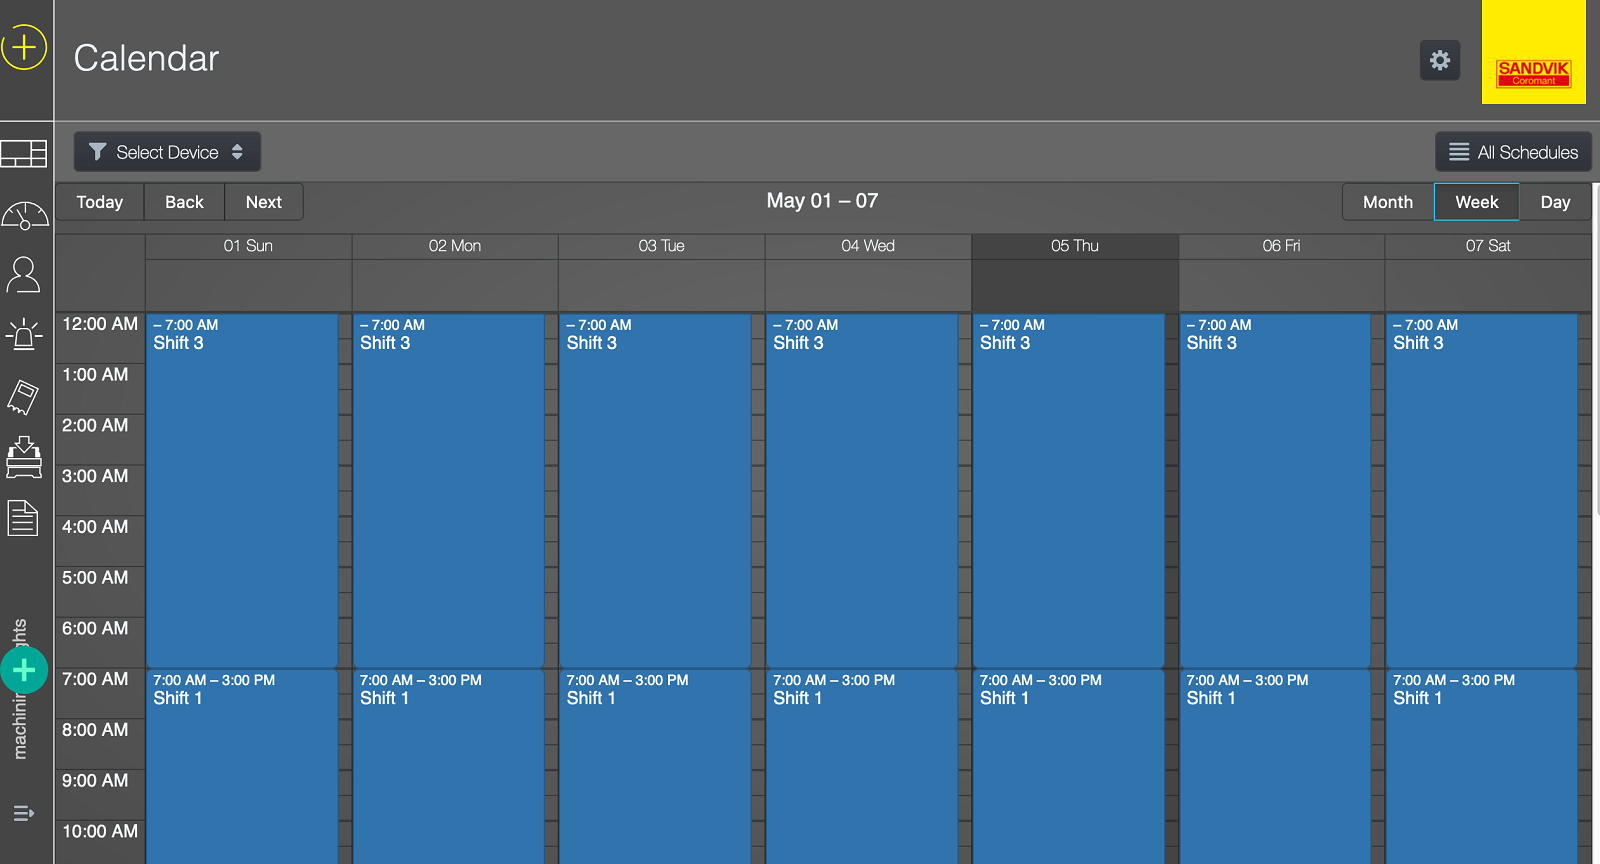
Calendar
In Calendar, you can see all created shift schedules. Here you can set a general plant schedule for all machines or create unique a schedule for an individual machine or a group of machines.
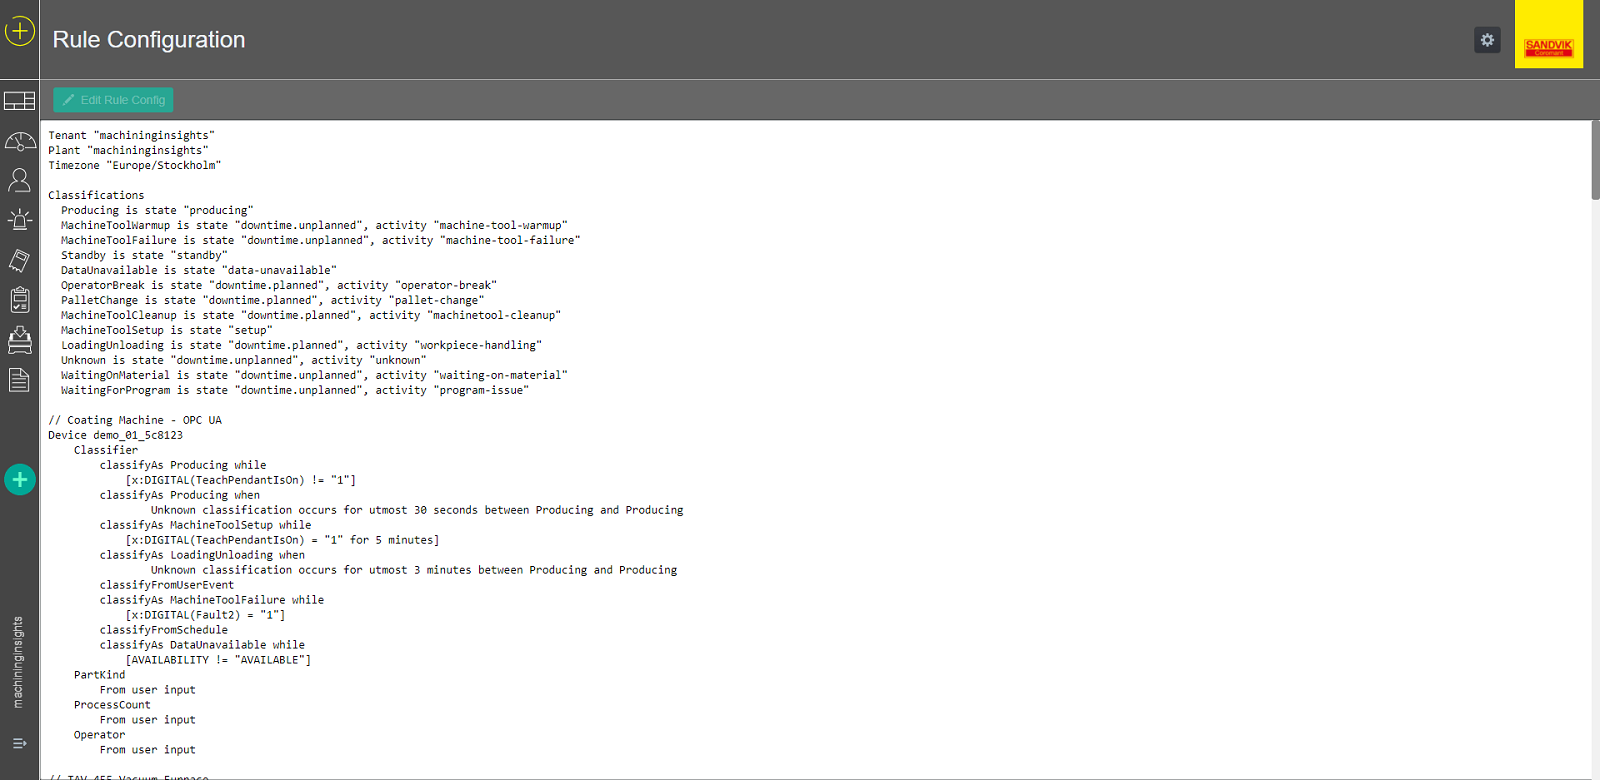
Rule configuration
In Rule configuration, you can see all the classification rules, alert rules and hierarchies associated with all the devices connected.
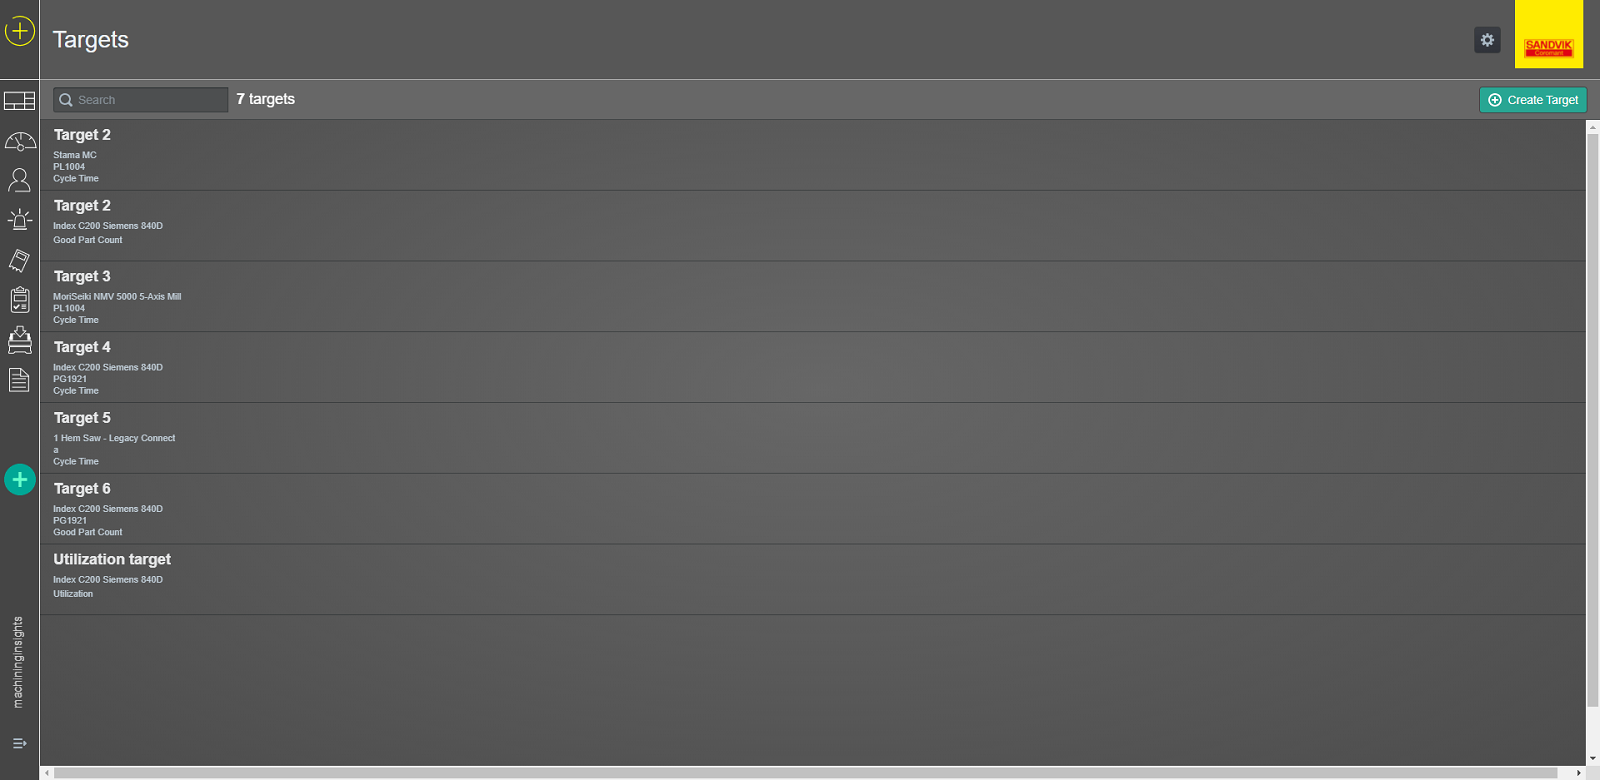
Target
In Target, you can see all defined targets or create a new target for your machining process.