
Getting started
Coromant Capto® DTH Plus software helps you use your driven tool holder efficiently, predict the maintenance need and plan accordingly.
Onbo
arding
Open the Quick start guide and follow the steps for installing the Coromant Capto® DTH Plus software. Log in to the license administration page and activate your driven tool holder.
Working with Coromant Capto® DTH Plus
The application’s Home screen is the initial point for accessing all pages.
- Home The Home screen informs you about the latest updates and displays your saved data. All your tools connected to this device will show up in two lists. The LIVE TOOLS list contains all running tools. The OFFLINE TOOLS list contains all tools in sleep mode.
- Tool View Watch your live data and get the tool information and history on the Tool View page. The live data includes the remaining lifetime, vibration level and more. In addition, it gives you a process summary and informs you about alarms and warnings.
- Settings Get essential information about your Coromant Capto® DTH Plus solution and configure the application, like changing the language or unit.
- ? (Question mark) Access the help slides for the current display page.
Tool View
Use the Tool View page to see how your machining process is performing, specific tool information and your tool holder’s history.
Live Data
You can see all the live data streaming from the tool in the Live Data section.
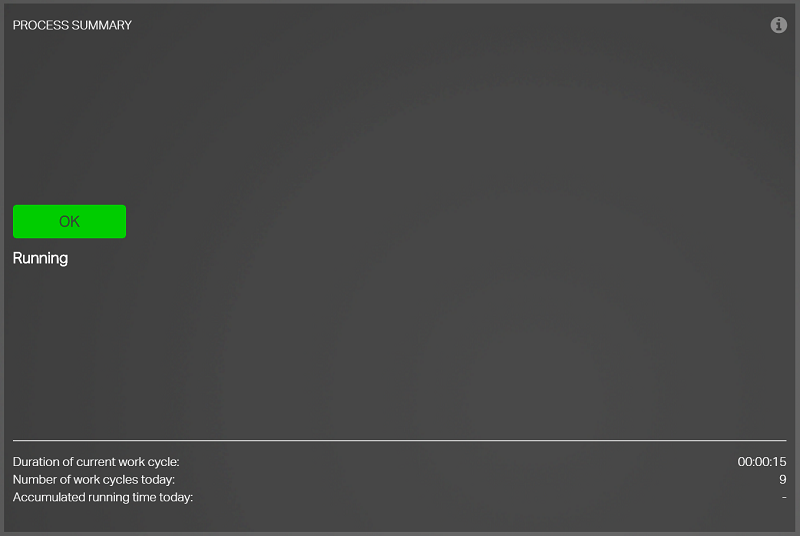
Process summary
Process summary indicates the current status of the tool and process. The status indicator will turn
- Green, when the tool is running and conditions are stable.
- Yellow or red when warnings or alerts are generated.
The Process summary tile also counts the number of work cycles and running time of the day so that the process can be more closely followed and optimized.
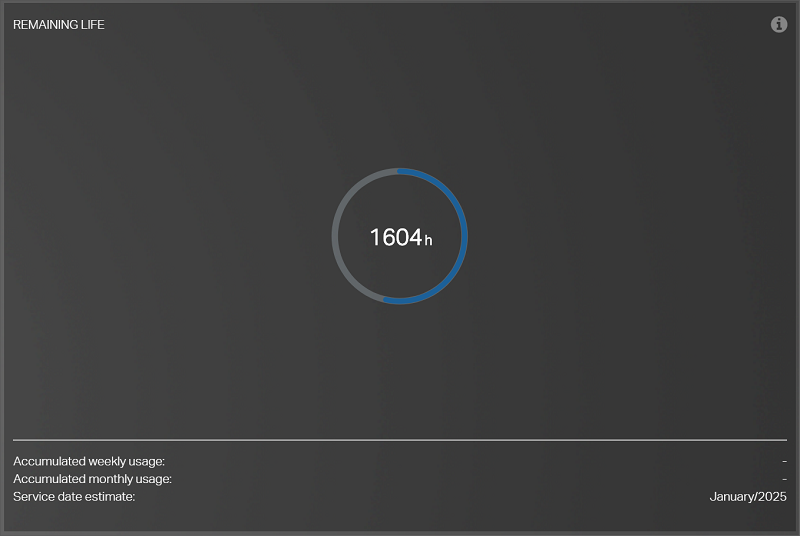
Remaining life
The Remaining life estimates how many hours it is left until service of the driven tool holder is needed. Like your car, you get a notification that you have 100hrs left before service is needed. Both information is based on how often you used your car or tool holder.
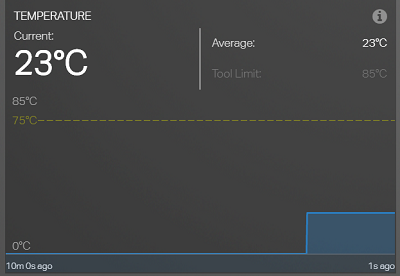
Temperature
The Temparature presented is the temperature of the tool holder.
Use this data field to ensure that you are within limits for the tool holders to reduce the risk of bearing failures that are unnecessarily worn on the sealings inside the driven tool holders.
Unusually high temperatures indicate that the units have been used at very high RPMs for a long time without coolant. Use coolant if possible, especially if you have long cycle times at high RPMs.
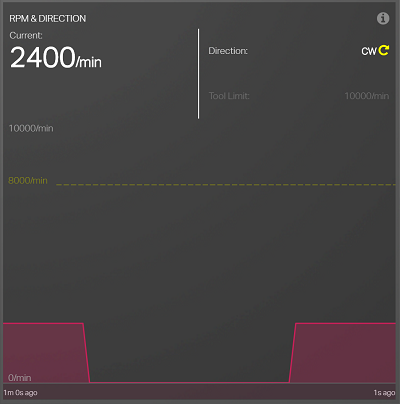
RPM & Direction
The current RPM is shown in the RPM & Direction tile. The direction of rotation of the cutting tool is displayed with the yellow arrow. The text CW describes a clockwise, standard rotation and CCW (counterclockwise) for the opposite direction. You find the upper and yellow limit for the driven tool holder, and these limits are programmed and defined in the firmware from the factory. In the picture below, Max RPM is 10000 for this unit, and the yellow range starts at 8000 RPM.
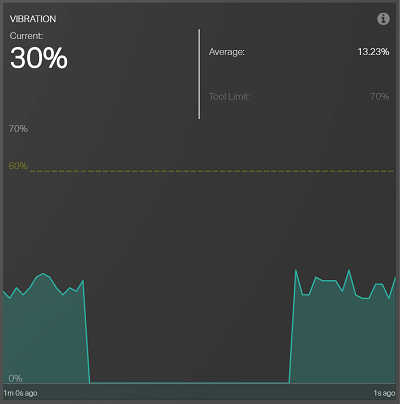
Vibration
The Vibration tile shows the current vibration level and if it is within limits.
And the limits are set in percentage of a specific frequency, individual for each Coromant Capto size.
Tool Details
In the Tool Details section, you can see all the necessary information about the tool, like tool dimensions and serial number. The current firmware version, license information, when the license expires and how many days it is possible to continue offline before an online ping is required is displayed. You can also create your name for the tool and add a picture of the tool. The default is a picture from the STP file. You can fill the DTH location, in storage, at service, or in the machine, starting with factory and machine, turret number and position.
Tool History
In the Tool History section, you can see how the tool has been used over time. You can also change the interval you want to check the tool history for if it is for a day, a week, a month or a year, and select which tool holder you want to see the history. Then you see the RPM, Temperature and Vibrations graphs in separate graphs.
